

The first working Monday of January is dubbed “Divorce Day”, supposedly the moment when married couples rush to end their marriages, and a rise in applications is seen. It has become one of the most repeated claims in the relationship calendar…but is it actually true?
As family law solicitors, we’ve often been asked whether January really is the busiest time of the year for divorce applications. To find out the actual scale, we analysed Ministry of Justice family court data covering every divorce application made in England and Wales between 2020 and 2024 – more than 567,000 applications in total – to separate what people are told about divorce timing from what actually happens.
Key findings from our analysis of over 567,000 divorce applications include:
- There is no single “Divorce Day” – across the 5 years of data analysed, March ranked first with the highest number of total applications, followed by October, then January
- An average of 113,500 divorce applications were made each year in England and Wales – the equivalent to an average of one every 4.6 minutes over the course of a year
- December is the quietest month every year, with applications falling by up to a third before rebounding by as much as 66% in January
- The introduction of no-fault divorce in April 2022 drove a 50% year-on-year spike, with around 9,000 additional applications clustered around the law change
Is “Divorce Day” real? What the data actually shows
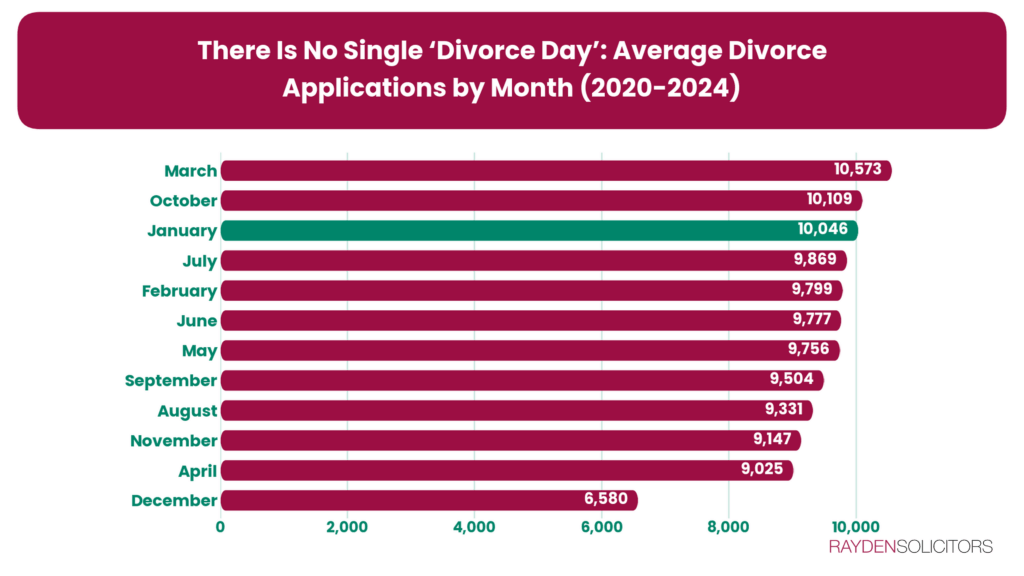
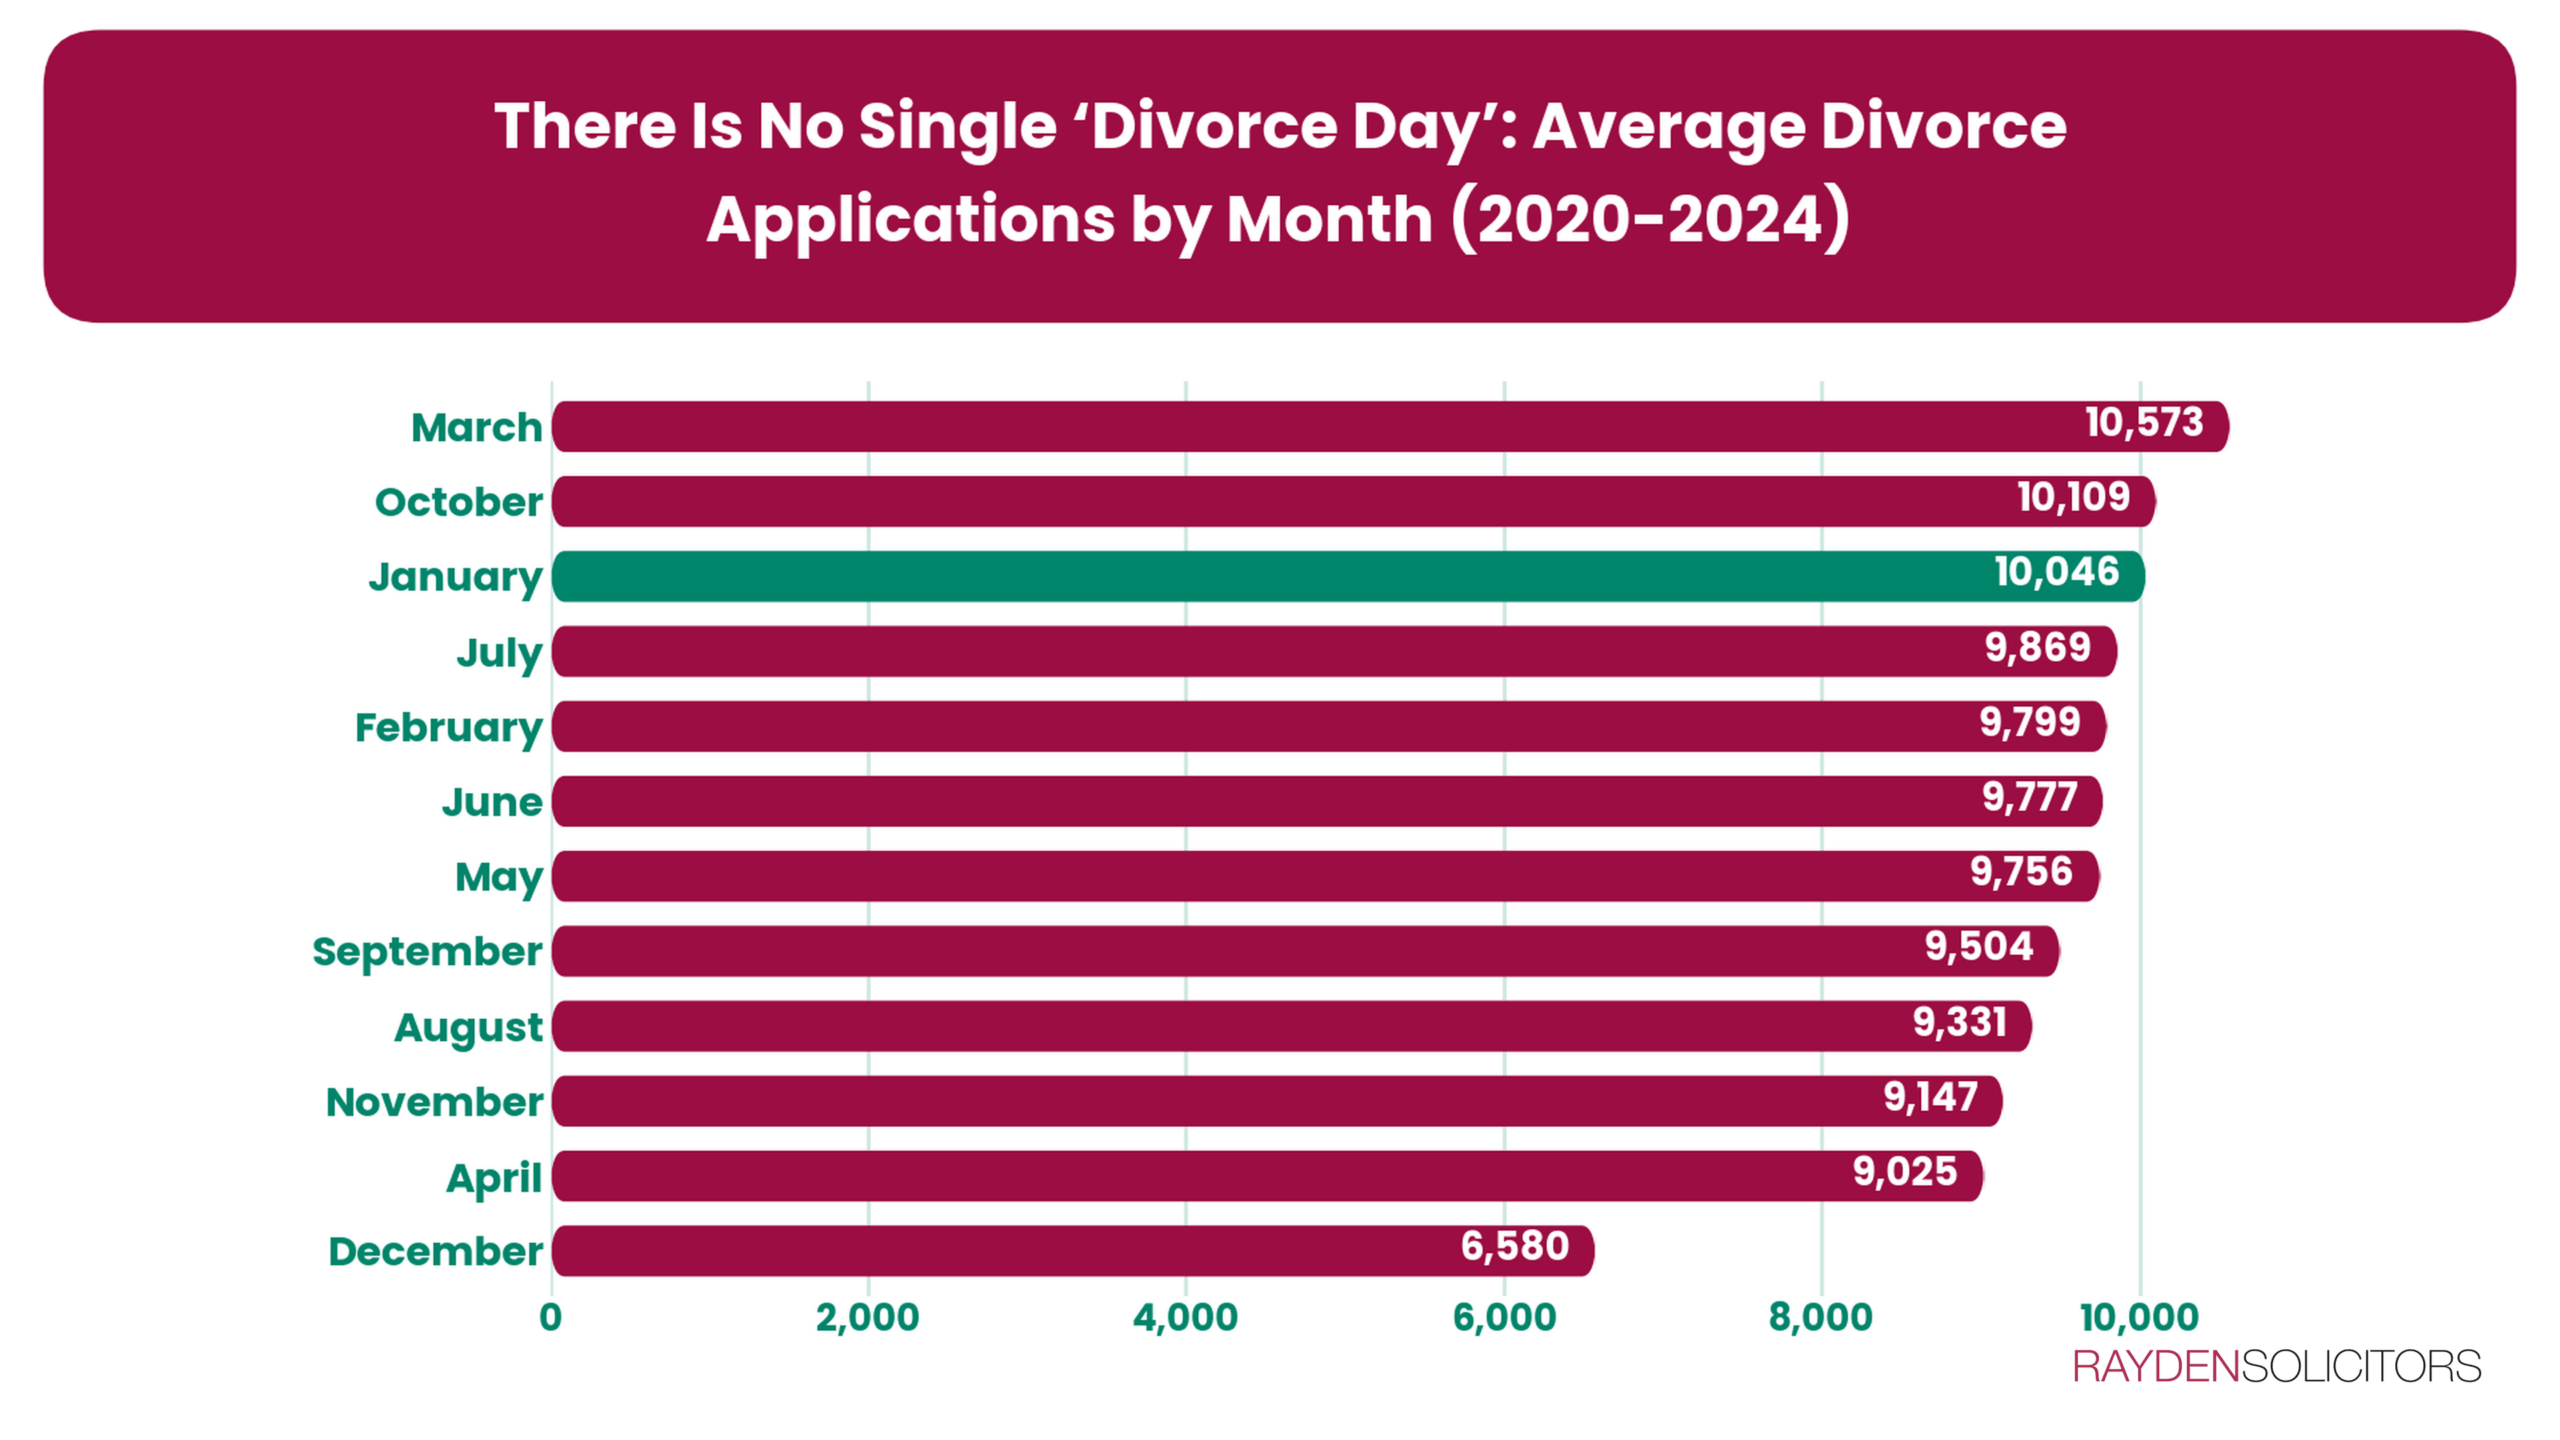
Across the five years of data analysed, January averaged 10,046 applications – the third-highest month, behind March (10,573) and October (10,109). However, the differences at the top of the table are very minor.
Once the pandemic and law-change years are set aside, January (10,383), February (10,146) and March (10,086) sit within roughly 3% of one another and are similar statistically, rather than a single standout “Divorce Day”.
What is real is the January rebound. Applications fall in December, followed by a surge back at the start of the year – rising by between 31% and 66% from December to January across the five years. In other words, January’s “surge” is a return to normal after the quietest month of the year, rather than an unusual ‘peak’.
“Every January, we see headlines about ‘Divorce Day’, but the reality is a lot more nuanced than that. January is busy, but not significantly busier than February or March. What the data actually reflects is a pause over Christmas followed by a return to normal levels. Families understandably wait until the holidays are over before taking a step of this significance”, says Executive Partner, Julian Bremner.
Why the ‘busiest month for divorce’ isn’t actually what you think
On a simple five-year average, March is the busiest month for divorce applications (10,573), followed by October (10,109). But even this comes with a caveat. March’s average is inflated by March 2022, when applications hit 12,356, around 31% higher than in March 2024, as couples rushed to file under the old law before no-fault divorce introduced a mandatory 20-week waiting period.
The honest conclusion from the data is that there is no “divorce season”. The timing of divorce is shaped far more by court processes, legal changes and practical life planning.
February: Valentine’s month has the highest daily rate of divorce applications

When it came to the highest average daily rate of applications, February ranked first in the study. However, the caveat here is that the length of a month can vary.
Once application volumes are adjusted for the number of days in each month, February moves to the top of the table – with an average of 347 applications per day, ahead of March (341) and January (324).
By the same measure, December falls to just 212 per day, meaning the daily rate of divorce applications in the month of Valentine’s Day is around 63% higher than in the month of Christmas.
Why is December always the quietest month?
If there is one truly reliable pattern across the data analysed, it’s December.
In every year from 2020 to 2024, applications fell by between 24% and 32% from November to December, averaging just 6,580 applications – around 30% below a normal month. Court closures and reduced office hours throughout the month will play a part, but so does simple human nature. Very few people want to begin divorce proceedings over Christmas, particularly where children are involved.
How ‘no-fault divorce’ reshaped two years of data
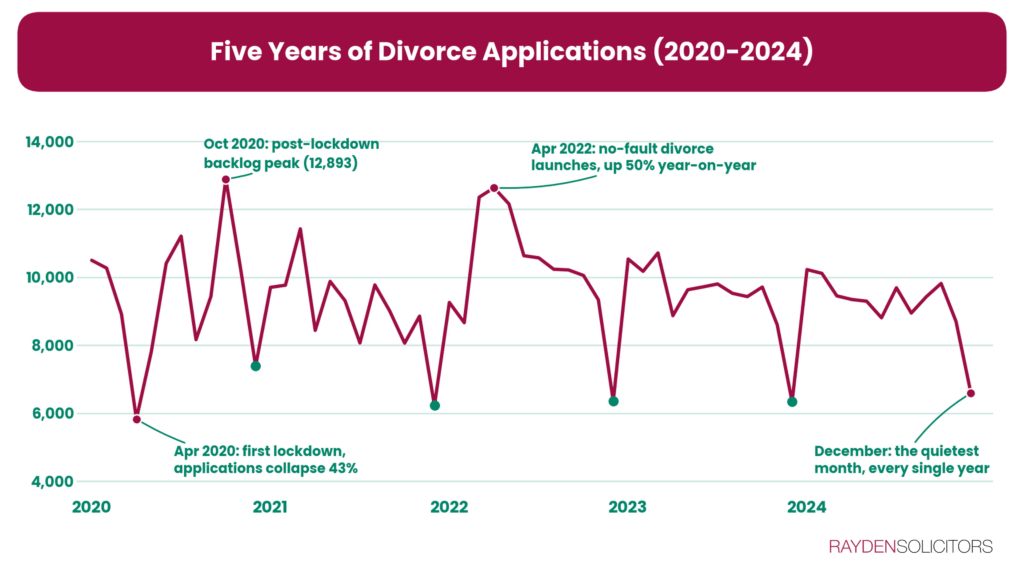
One of the largest changes in the data has less to do with emotions and more to do with law changes. When no-fault divorce came into force on 6 April 2022, applications jumped to 12,635 that month (up 50% on April 2021) as couples who had waited for blame-free divorce came forward at once.
Combined with the rush to file under the old rules in March, spring 2022 saw approximately 9,000 more applications than the same months in 2024, and 2022 as a whole finished 13% up on 2021.
Divorce applications are now falling
After the no-fault spike of 2022 (122,484 applications in total), volumes fell by 7.7% in 2023 and by a further 2.3% in 2024, to 110,428, the second-lowest annual total in the five years analysed.
This highlights a longer-term national picture of fewer marriages and more couples choosing to cohabit, with cohabiting couples now accounting for 17.7% of all families in the UK – a shift we explored in our previous research on relationship breakdown and housing.
“If the data shows anything, it is that divorce is not driven by a calendar. For anyone considering separation, understanding your financial position, arrangements for children, and what the timeline means for you are some of the most practical steps you can take. Speaking to experienced divorce solicitors at an early stage, whatever the month, is the best way to make informed decisions without pressure”, adds Julian.
Methodology
Monthly divorce application volumes for England and Wales were sourced from the Ministry of Justice / HMCTS Family Court Statistics Quarterly, covering January 2020 to December 2024 through a Freedom of Information request.
Five-year monthly averages were used to smooth year-to-year volatility, with months ranked from 1 (busiest) to 12 (quietest). Daily filing rates were calculated by dividing each month’s average by its number of calendar days (with February adjusted for leap years).
Three structural events are annotated and considered throughout: court disruption during the COVID-19 pandemic (2020), the rush to file ahead of the law change (March 2022), and the introduction of no-fault divorce (April 2022). Figures refer to divorce applications filed, not divorces granted.